Nothing yet? Start from one of ours.
A starter is two files: a dashboard and the spreadsheet it expects. Put your own numbers in, paste the dashboard into Larssoni, and it is live in a few minutes.
Get the spreadsheet.
Import the CSV into Google Sheets and put your own numbers in — same column names, same number of rows.
Paste the dashboard file.
Sign in to Larssoni and paste it in. It is live at a link.
Connect your sheet.
On the dashboard’s Data & refresh tab, connect your Google Sheet and choose a schedule.
Free includes three updates a month.
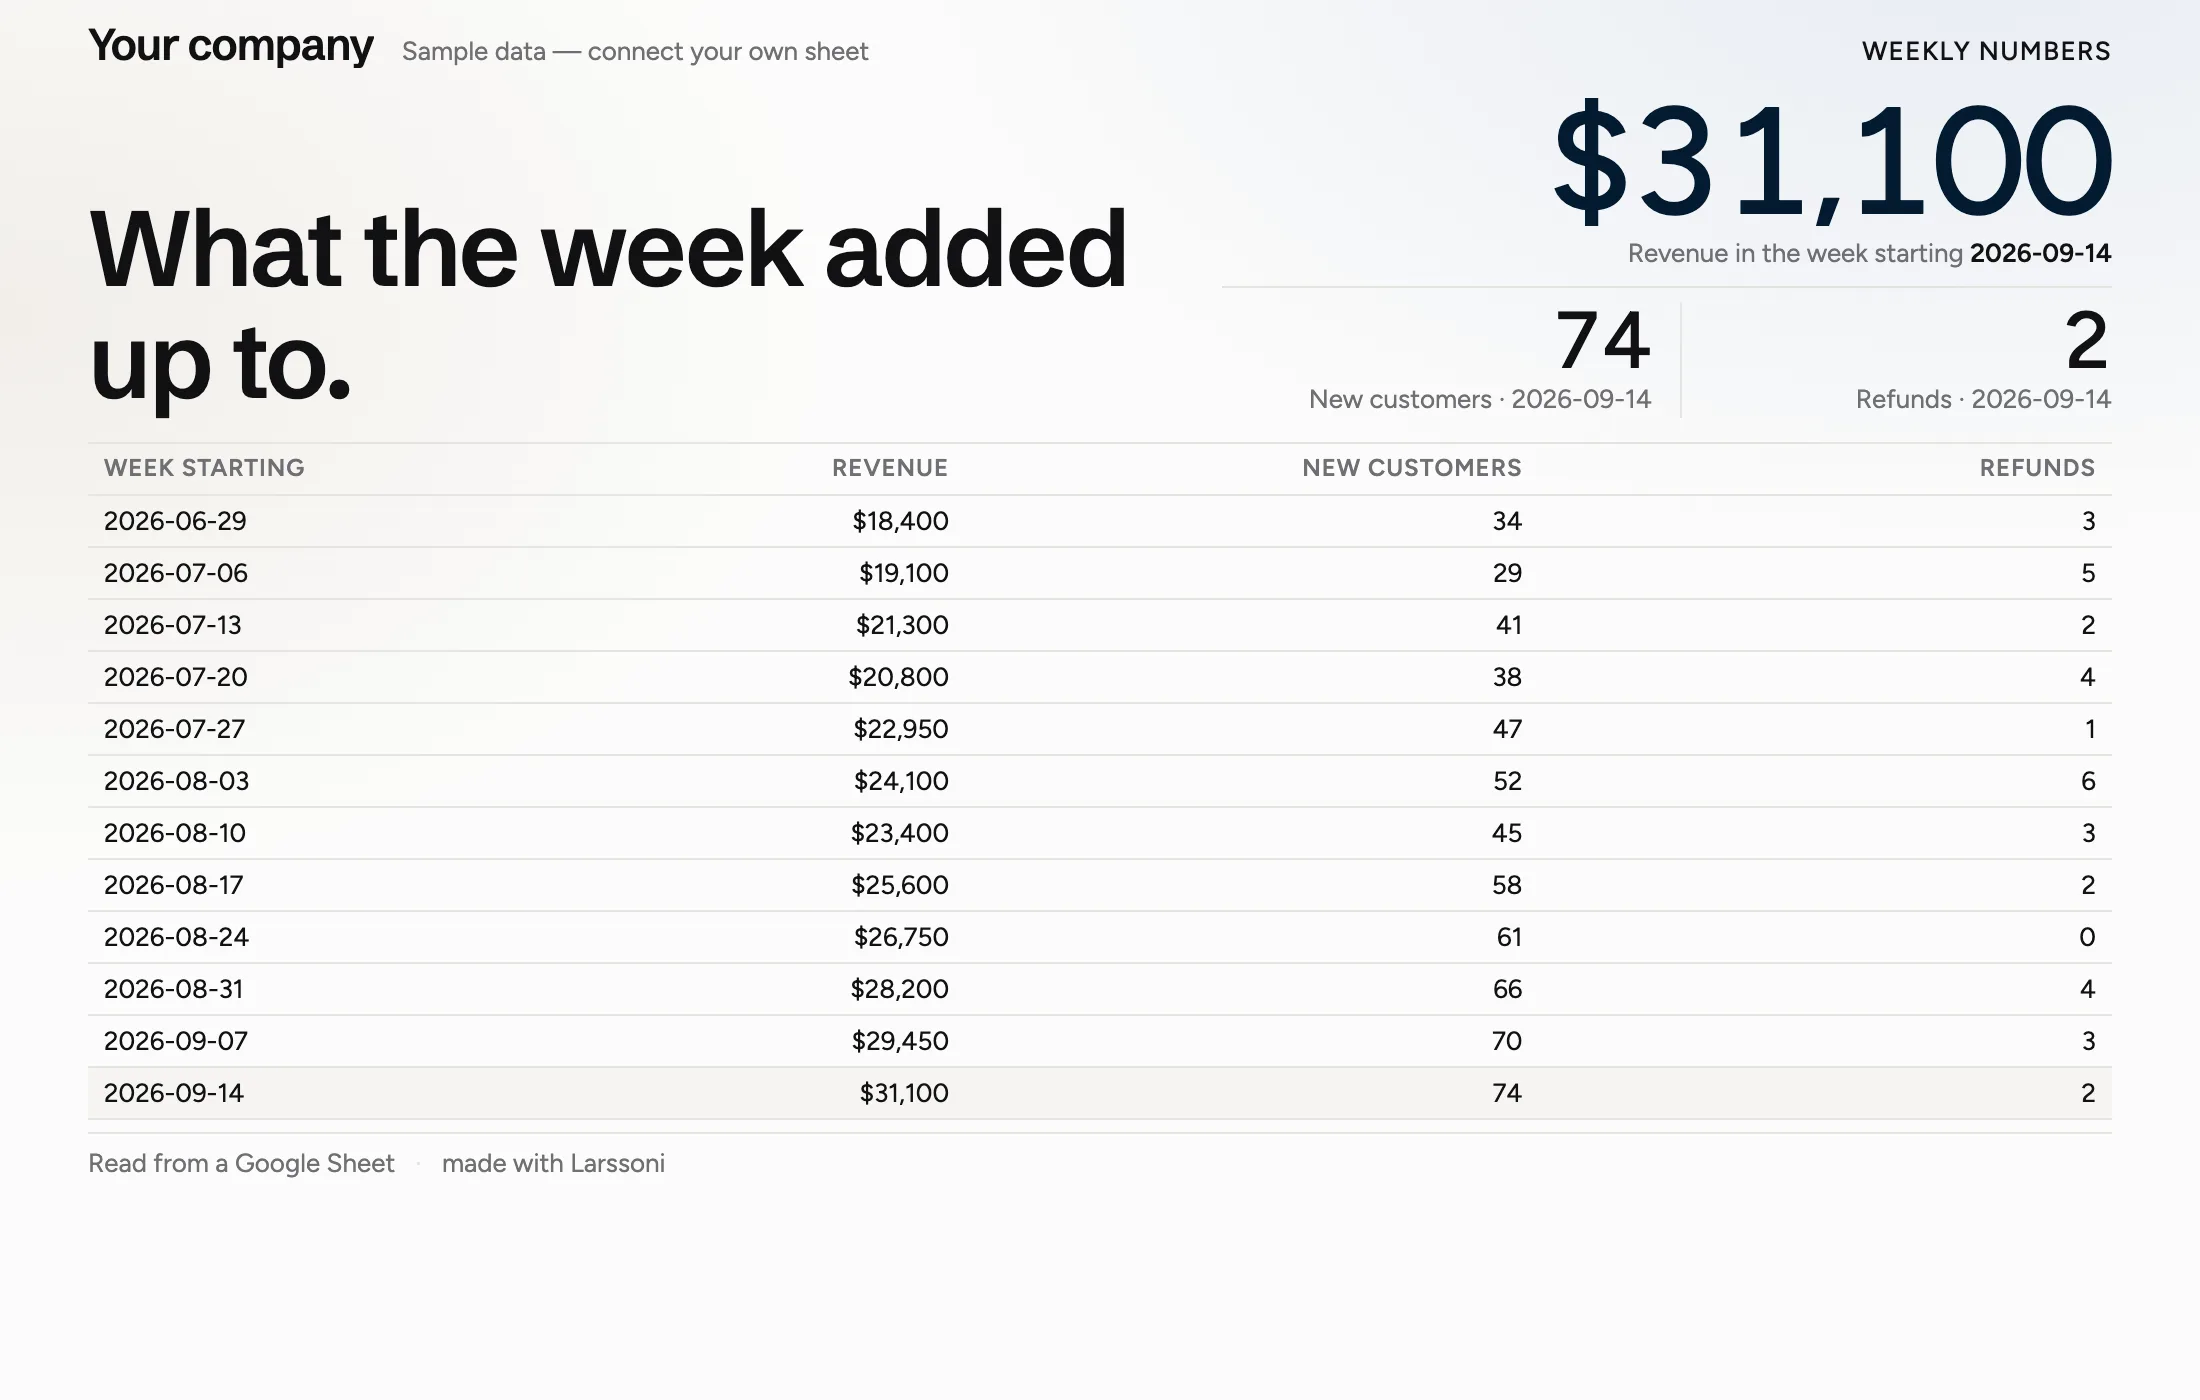
Weekly numbers
The numbers you report every week — a big headline figure plus two supporting ones, with the full history underneath.
- The spreadsheet
- week_starting · Revenue · New customers · Refunds12 rows
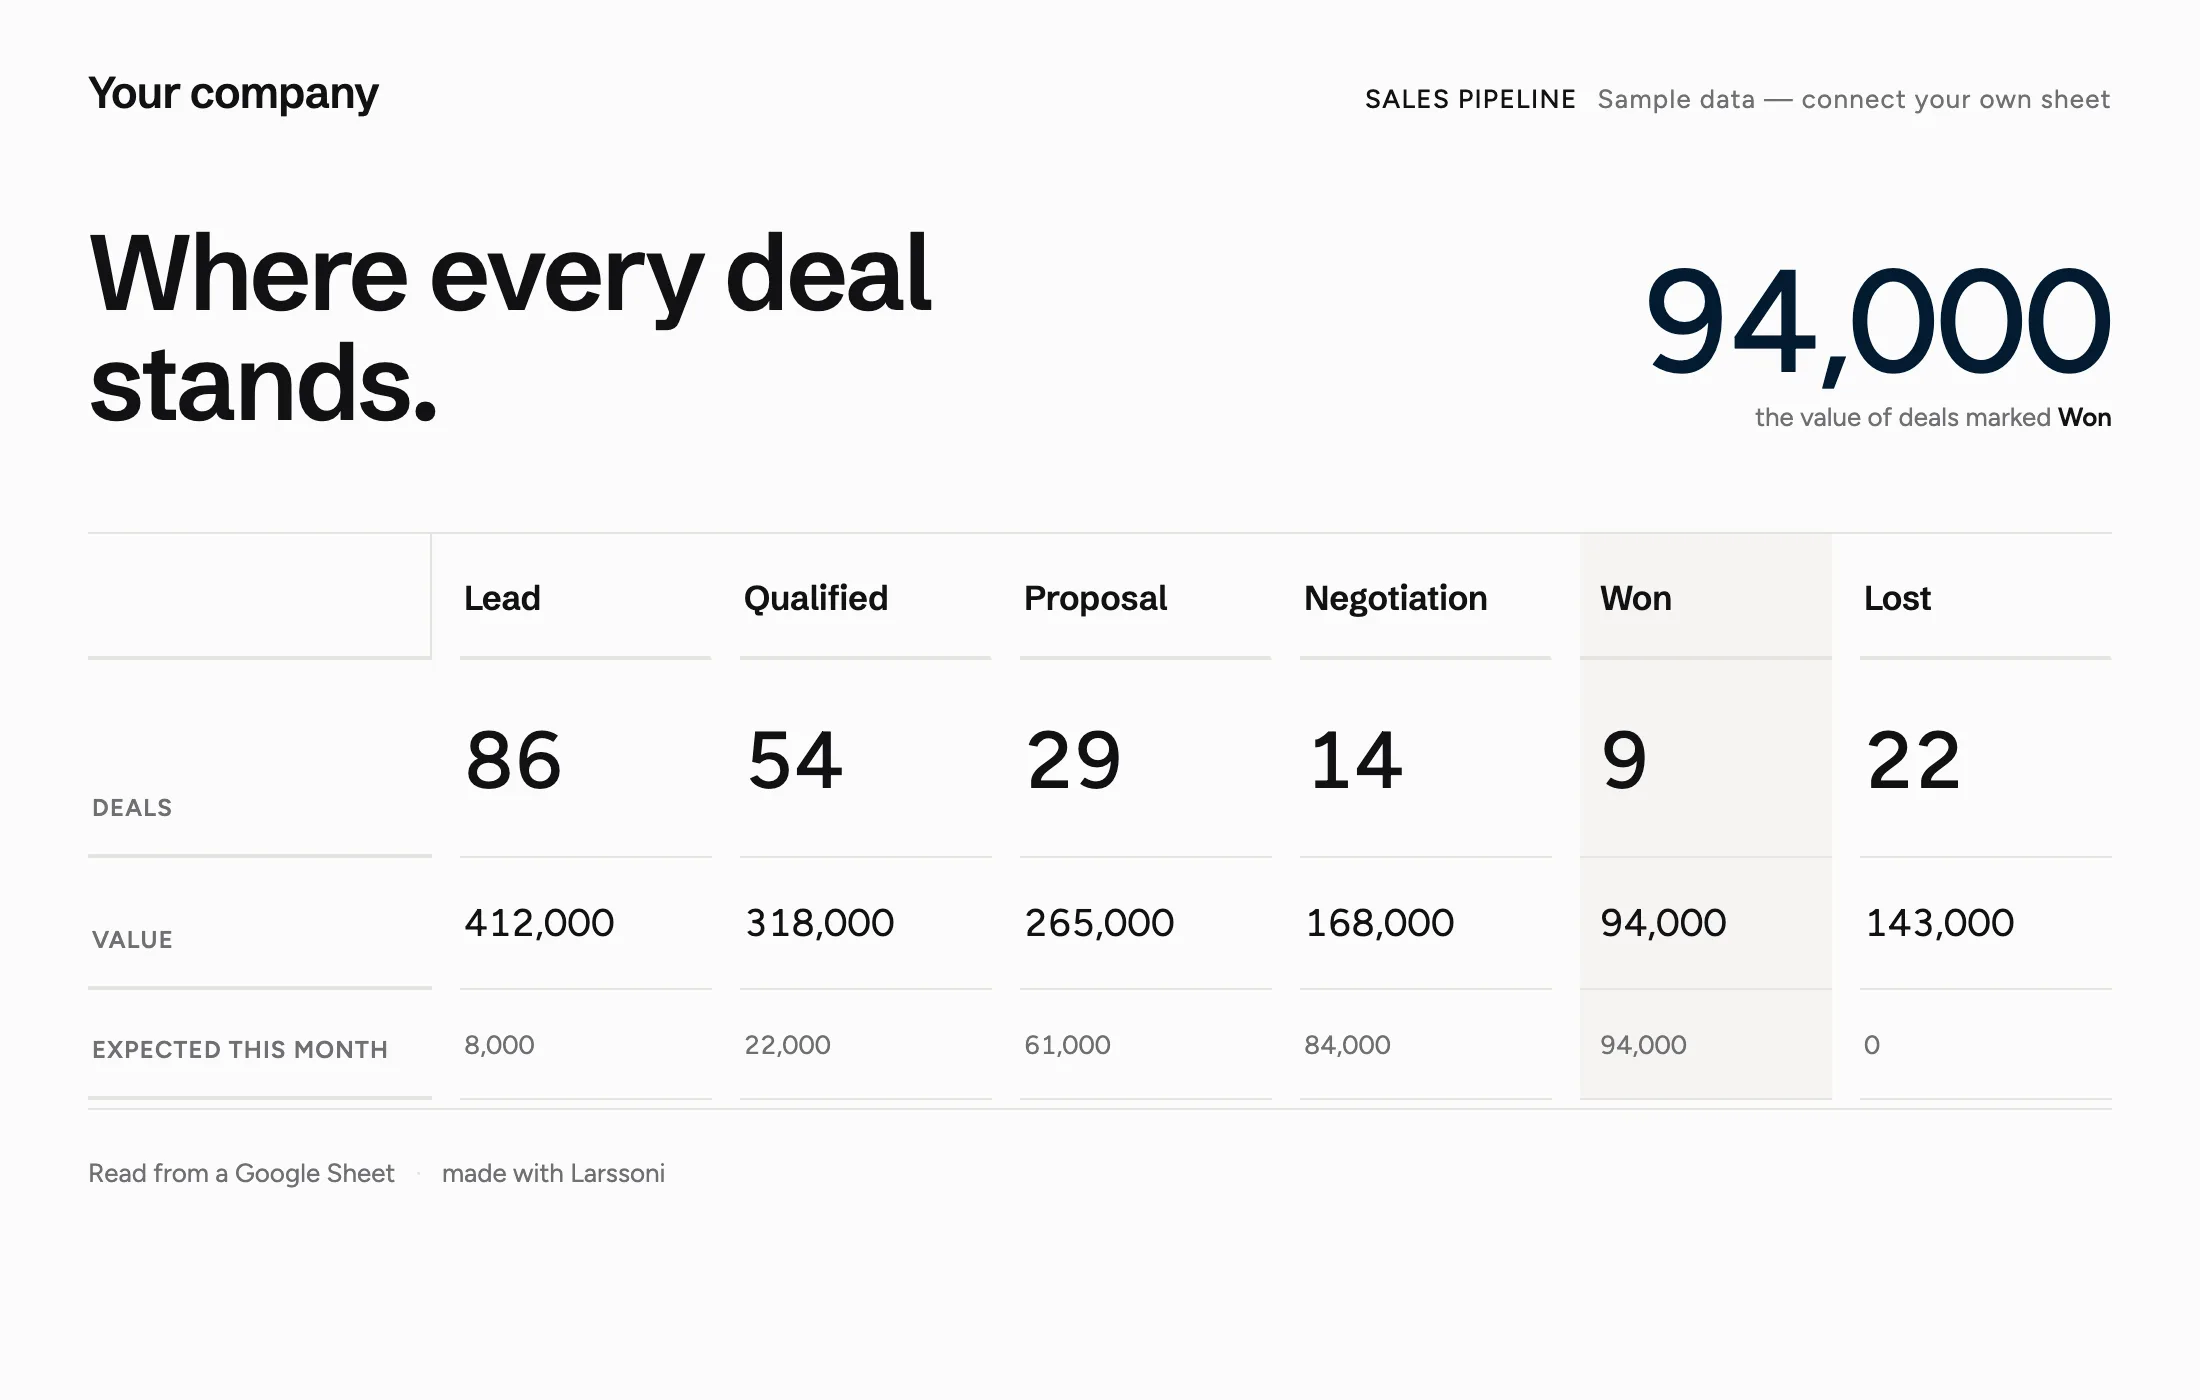
Sales pipeline
Six pipeline stages read left to right, with the value of deals marked Won as the one big figure.
- The spreadsheet
- stage · deals · value · expected_this_month6 rows
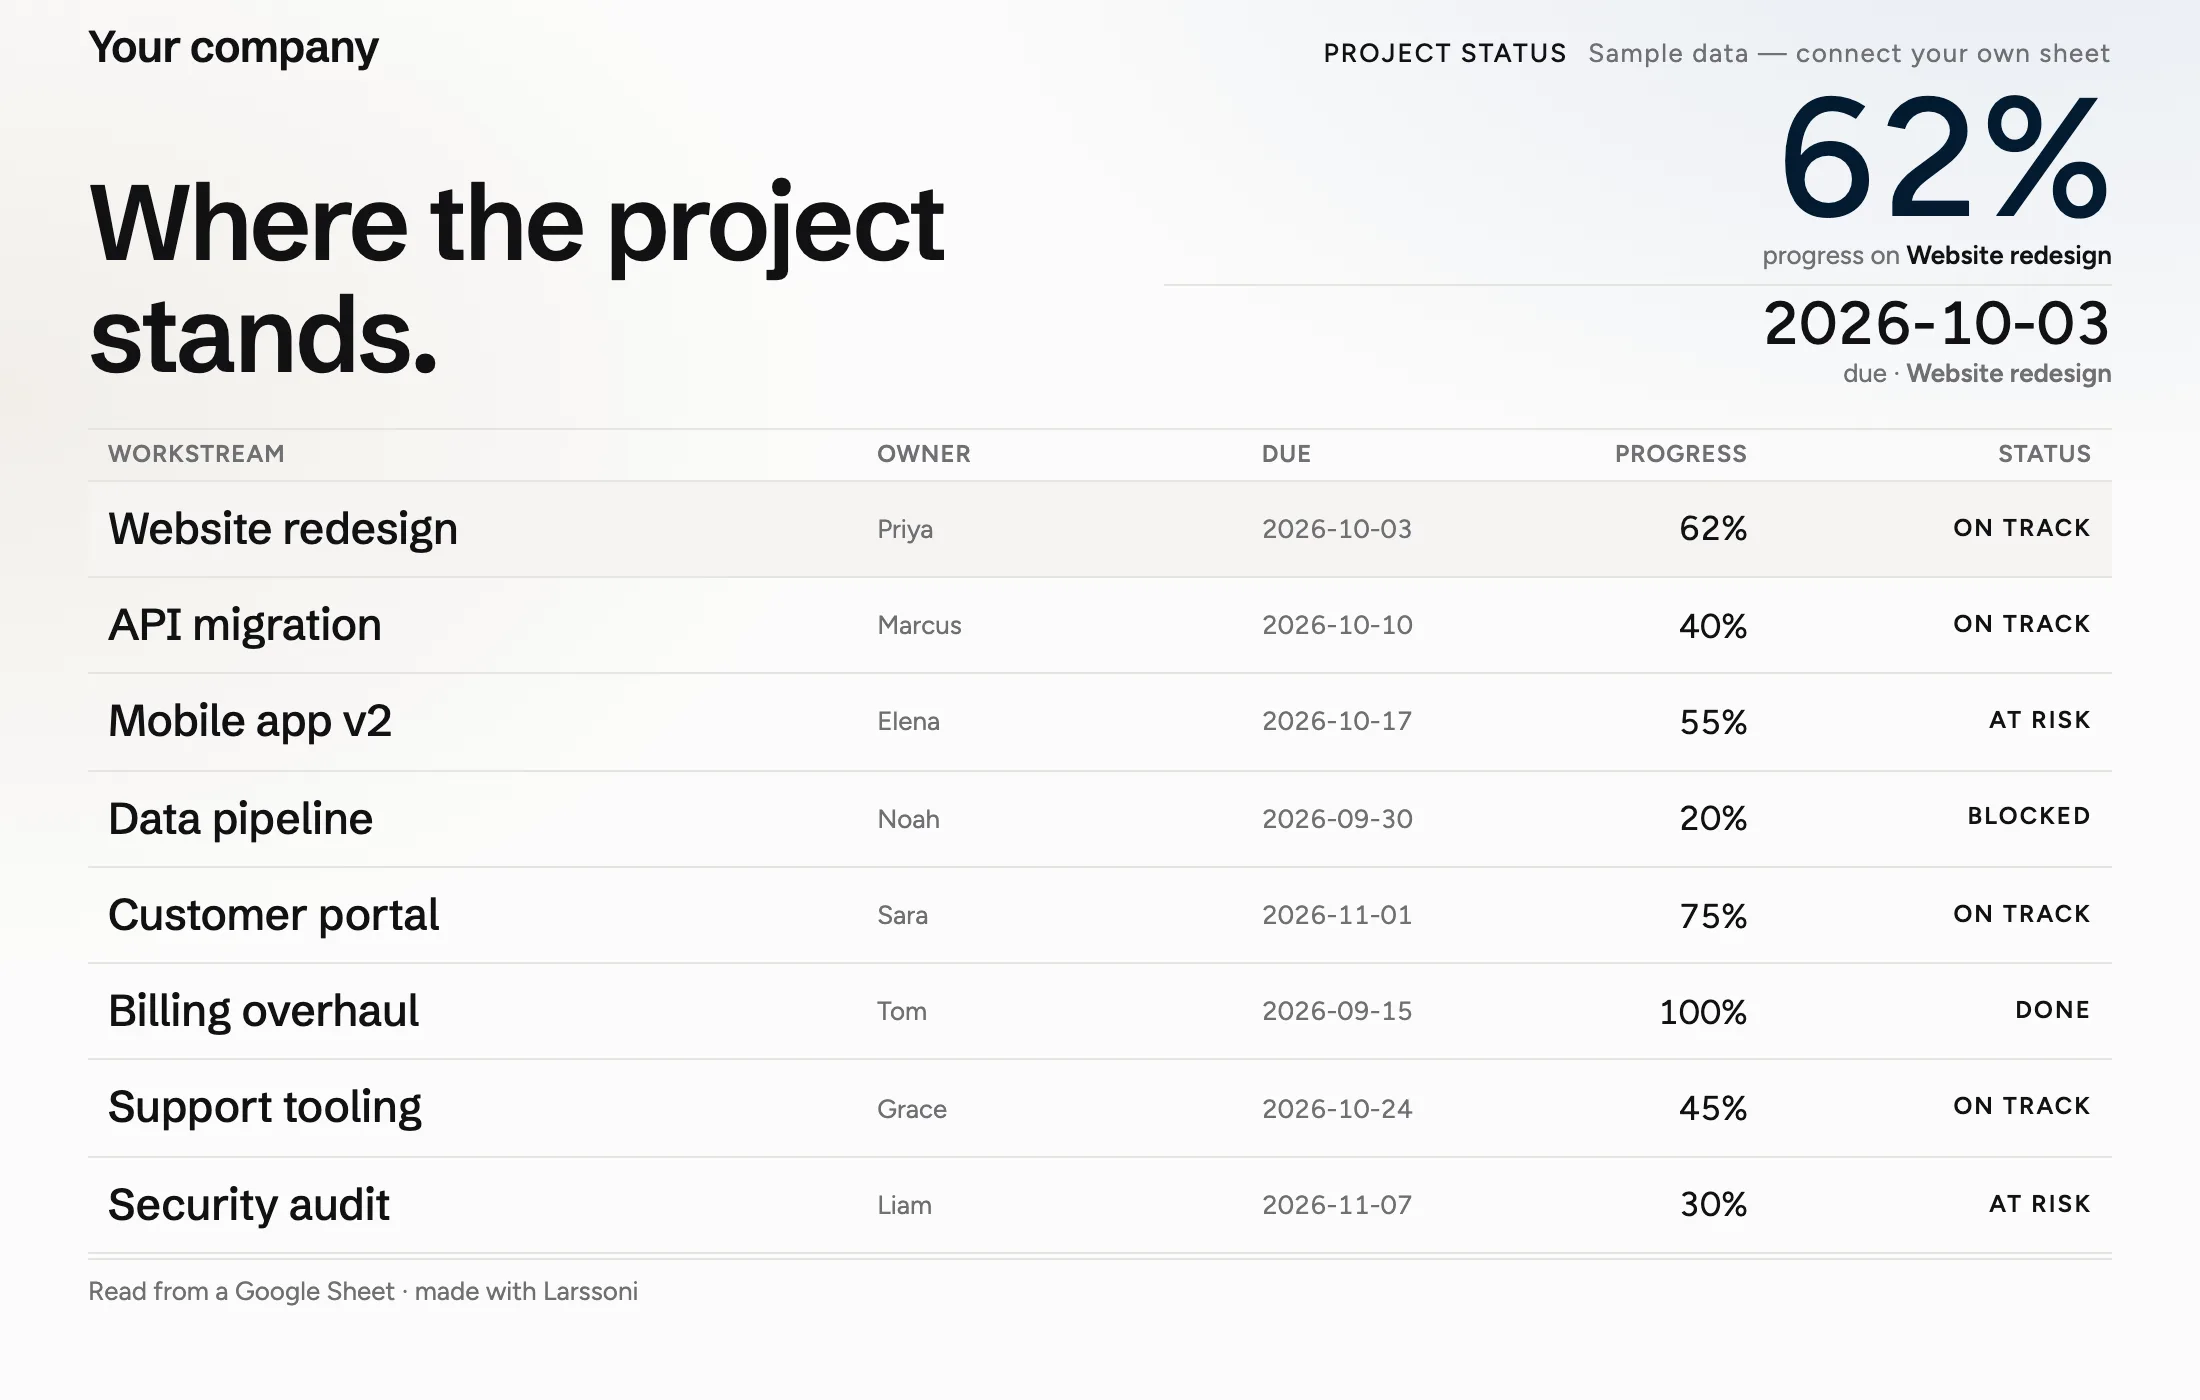
Project status
A status board for a fixed set of workstreams — what is on track and what is not, read straight from a spreadsheet.
- The spreadsheet
- workstream · owner · status · due · progress8 rows
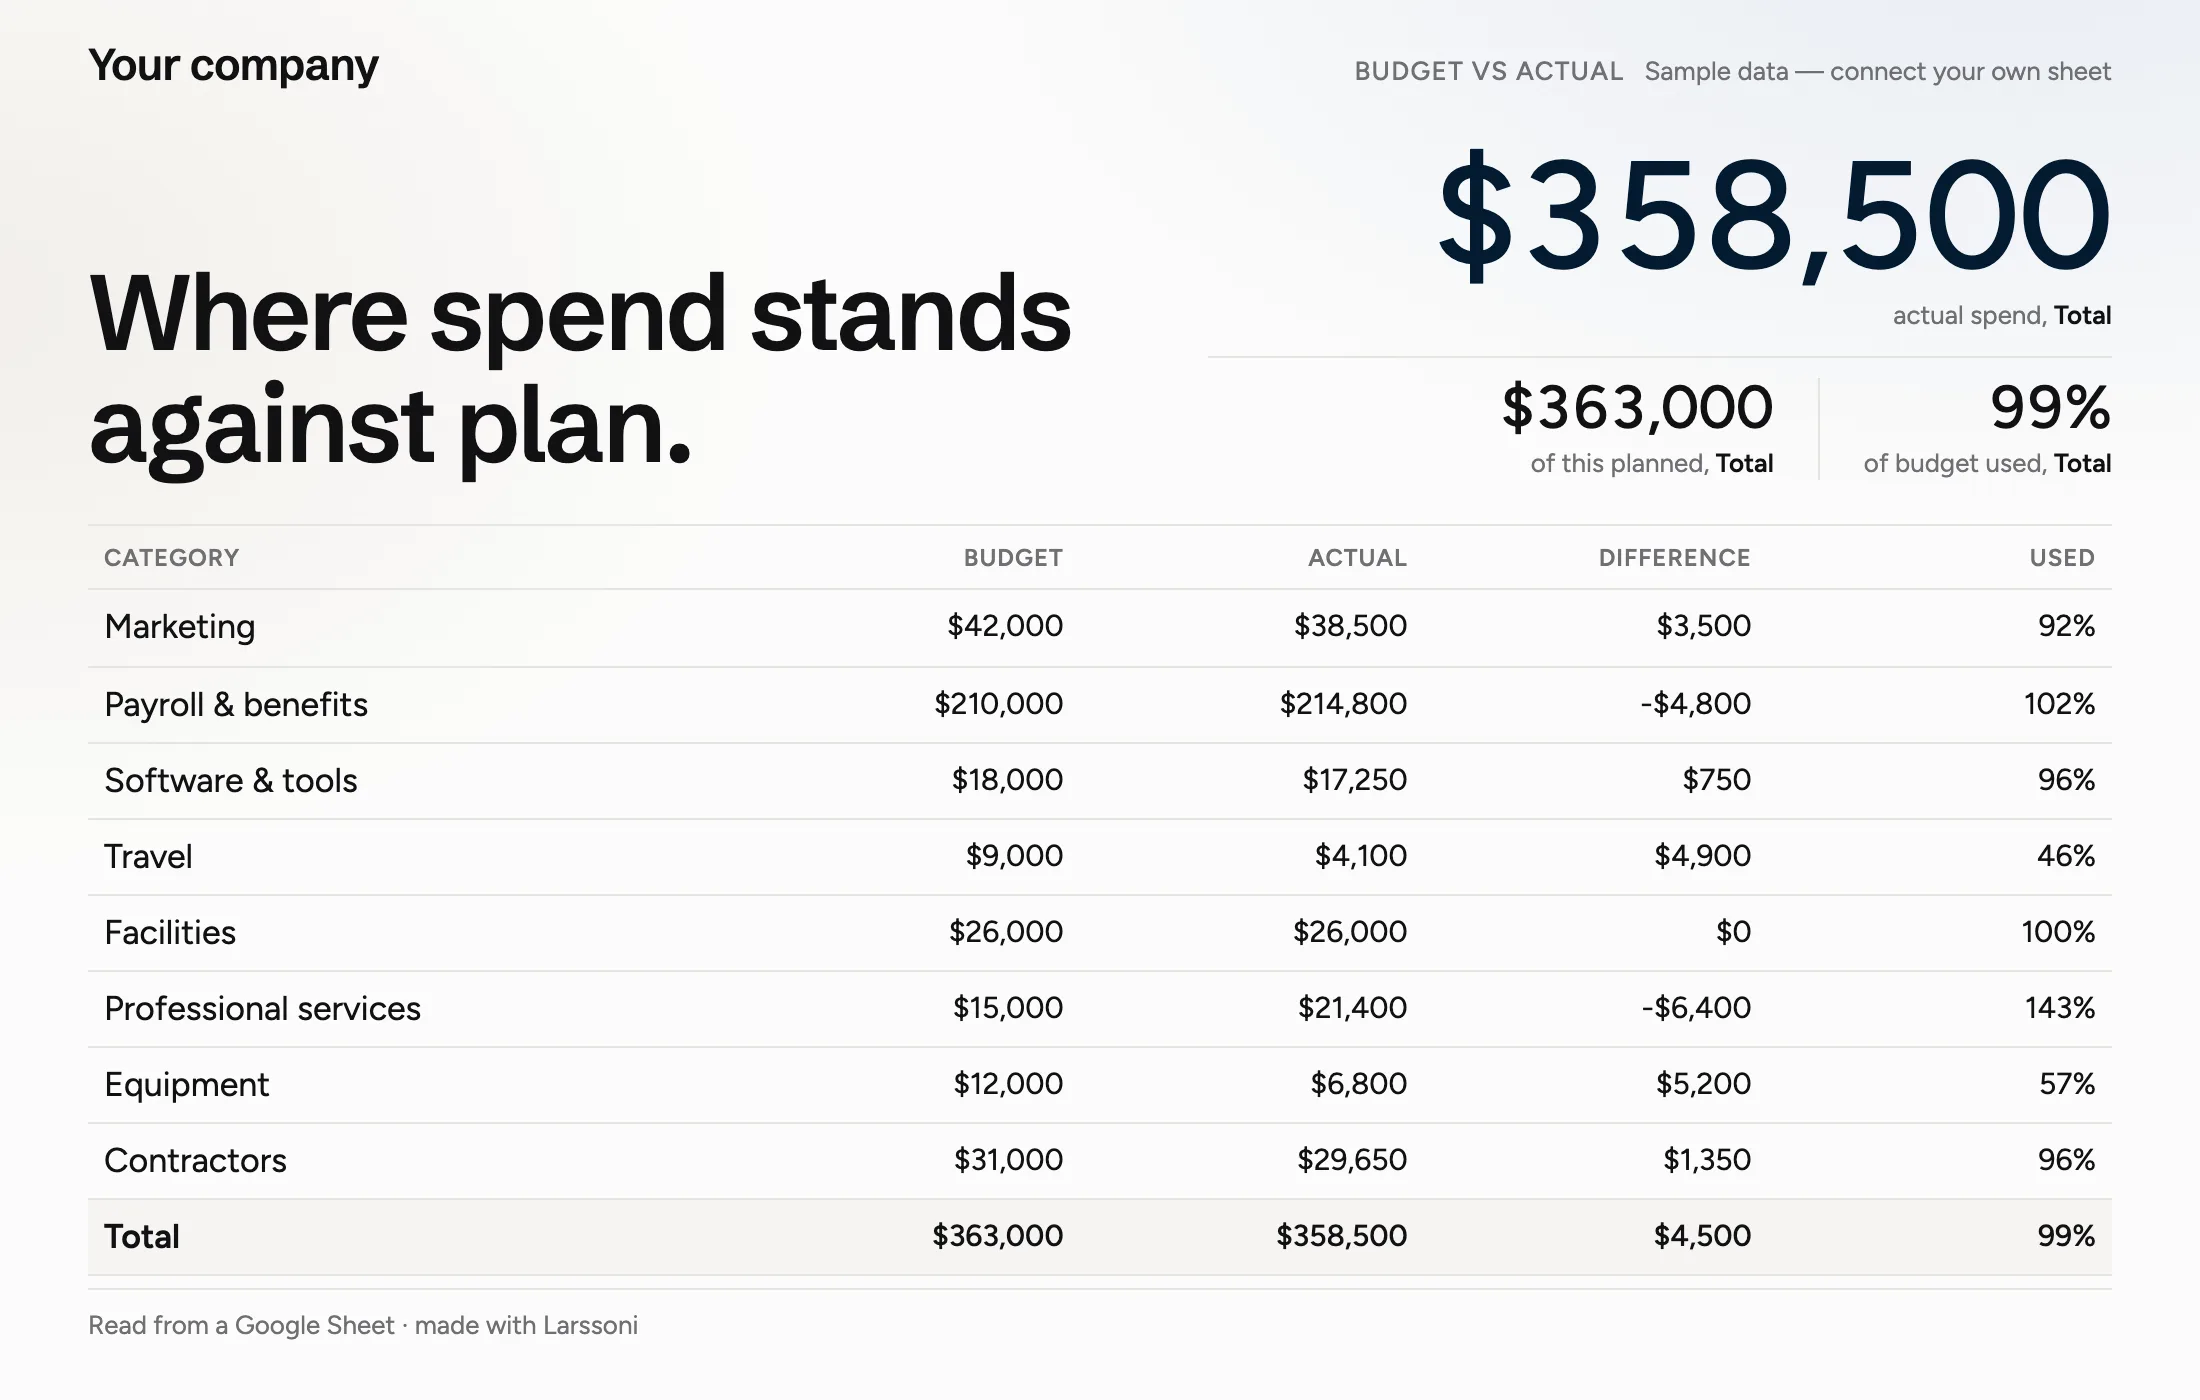
Budget vs actual
A monthly or quarterly report of spend against plan — one row per category, a Total row, and the headline figures for the period.
- The spreadsheet
- category · budget · actual · difference · used9 rows
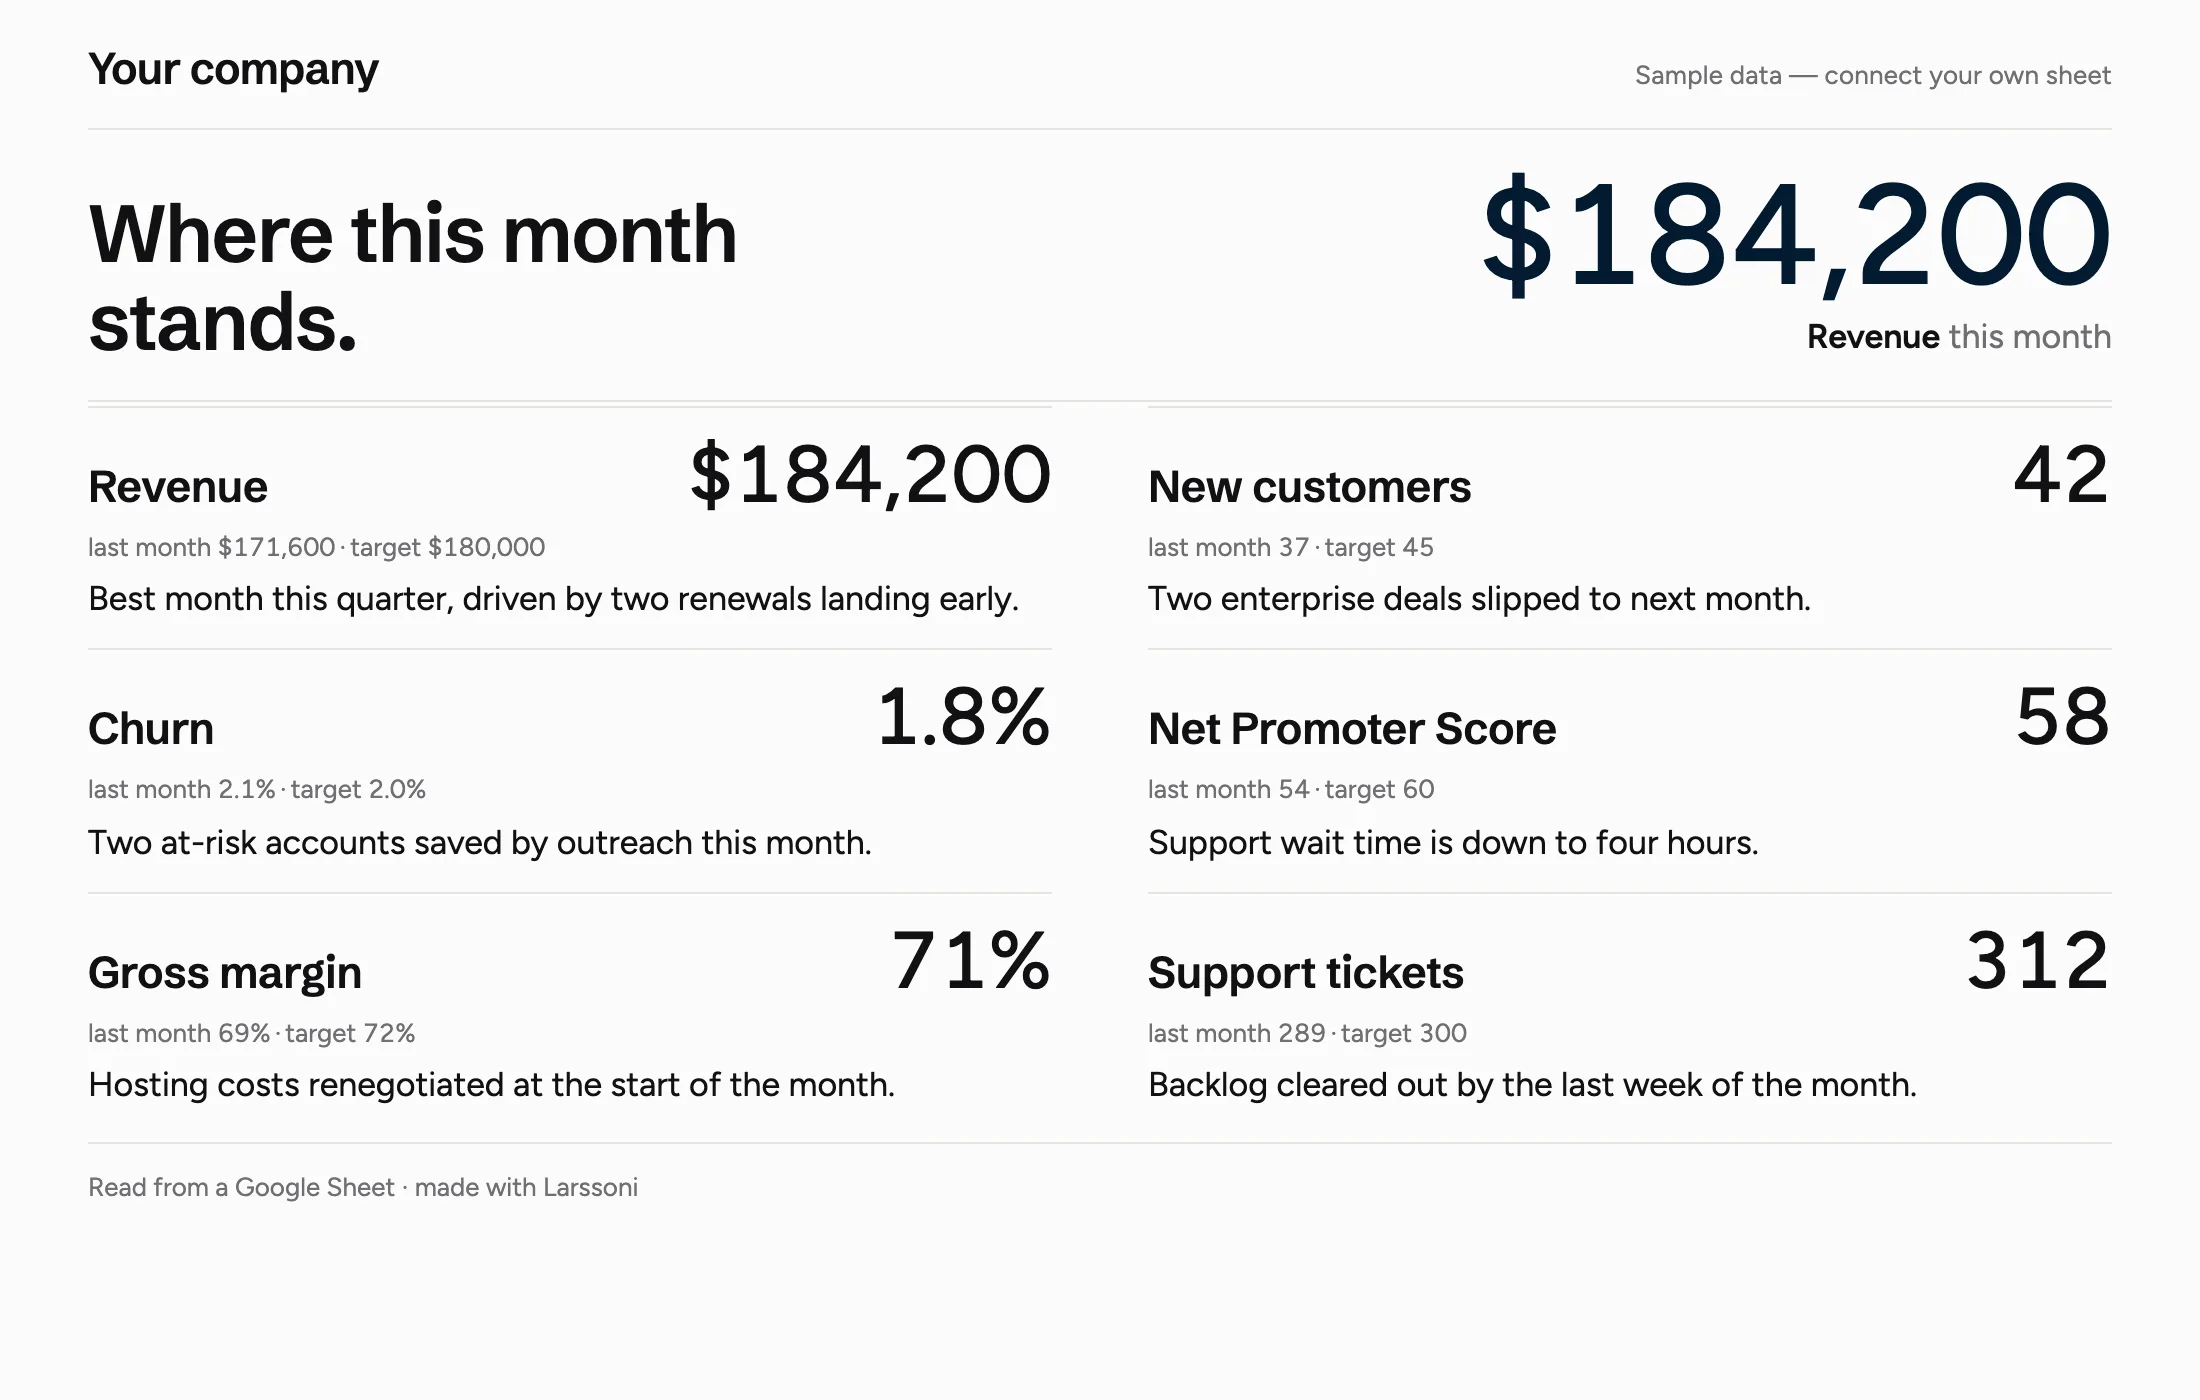
Monthly scorecard
A ledger of the six numbers a team reports every month, each with this month’s figure, last month’s and the target.
- The spreadsheet
- metric · this_month · last_month · target · note6 rows
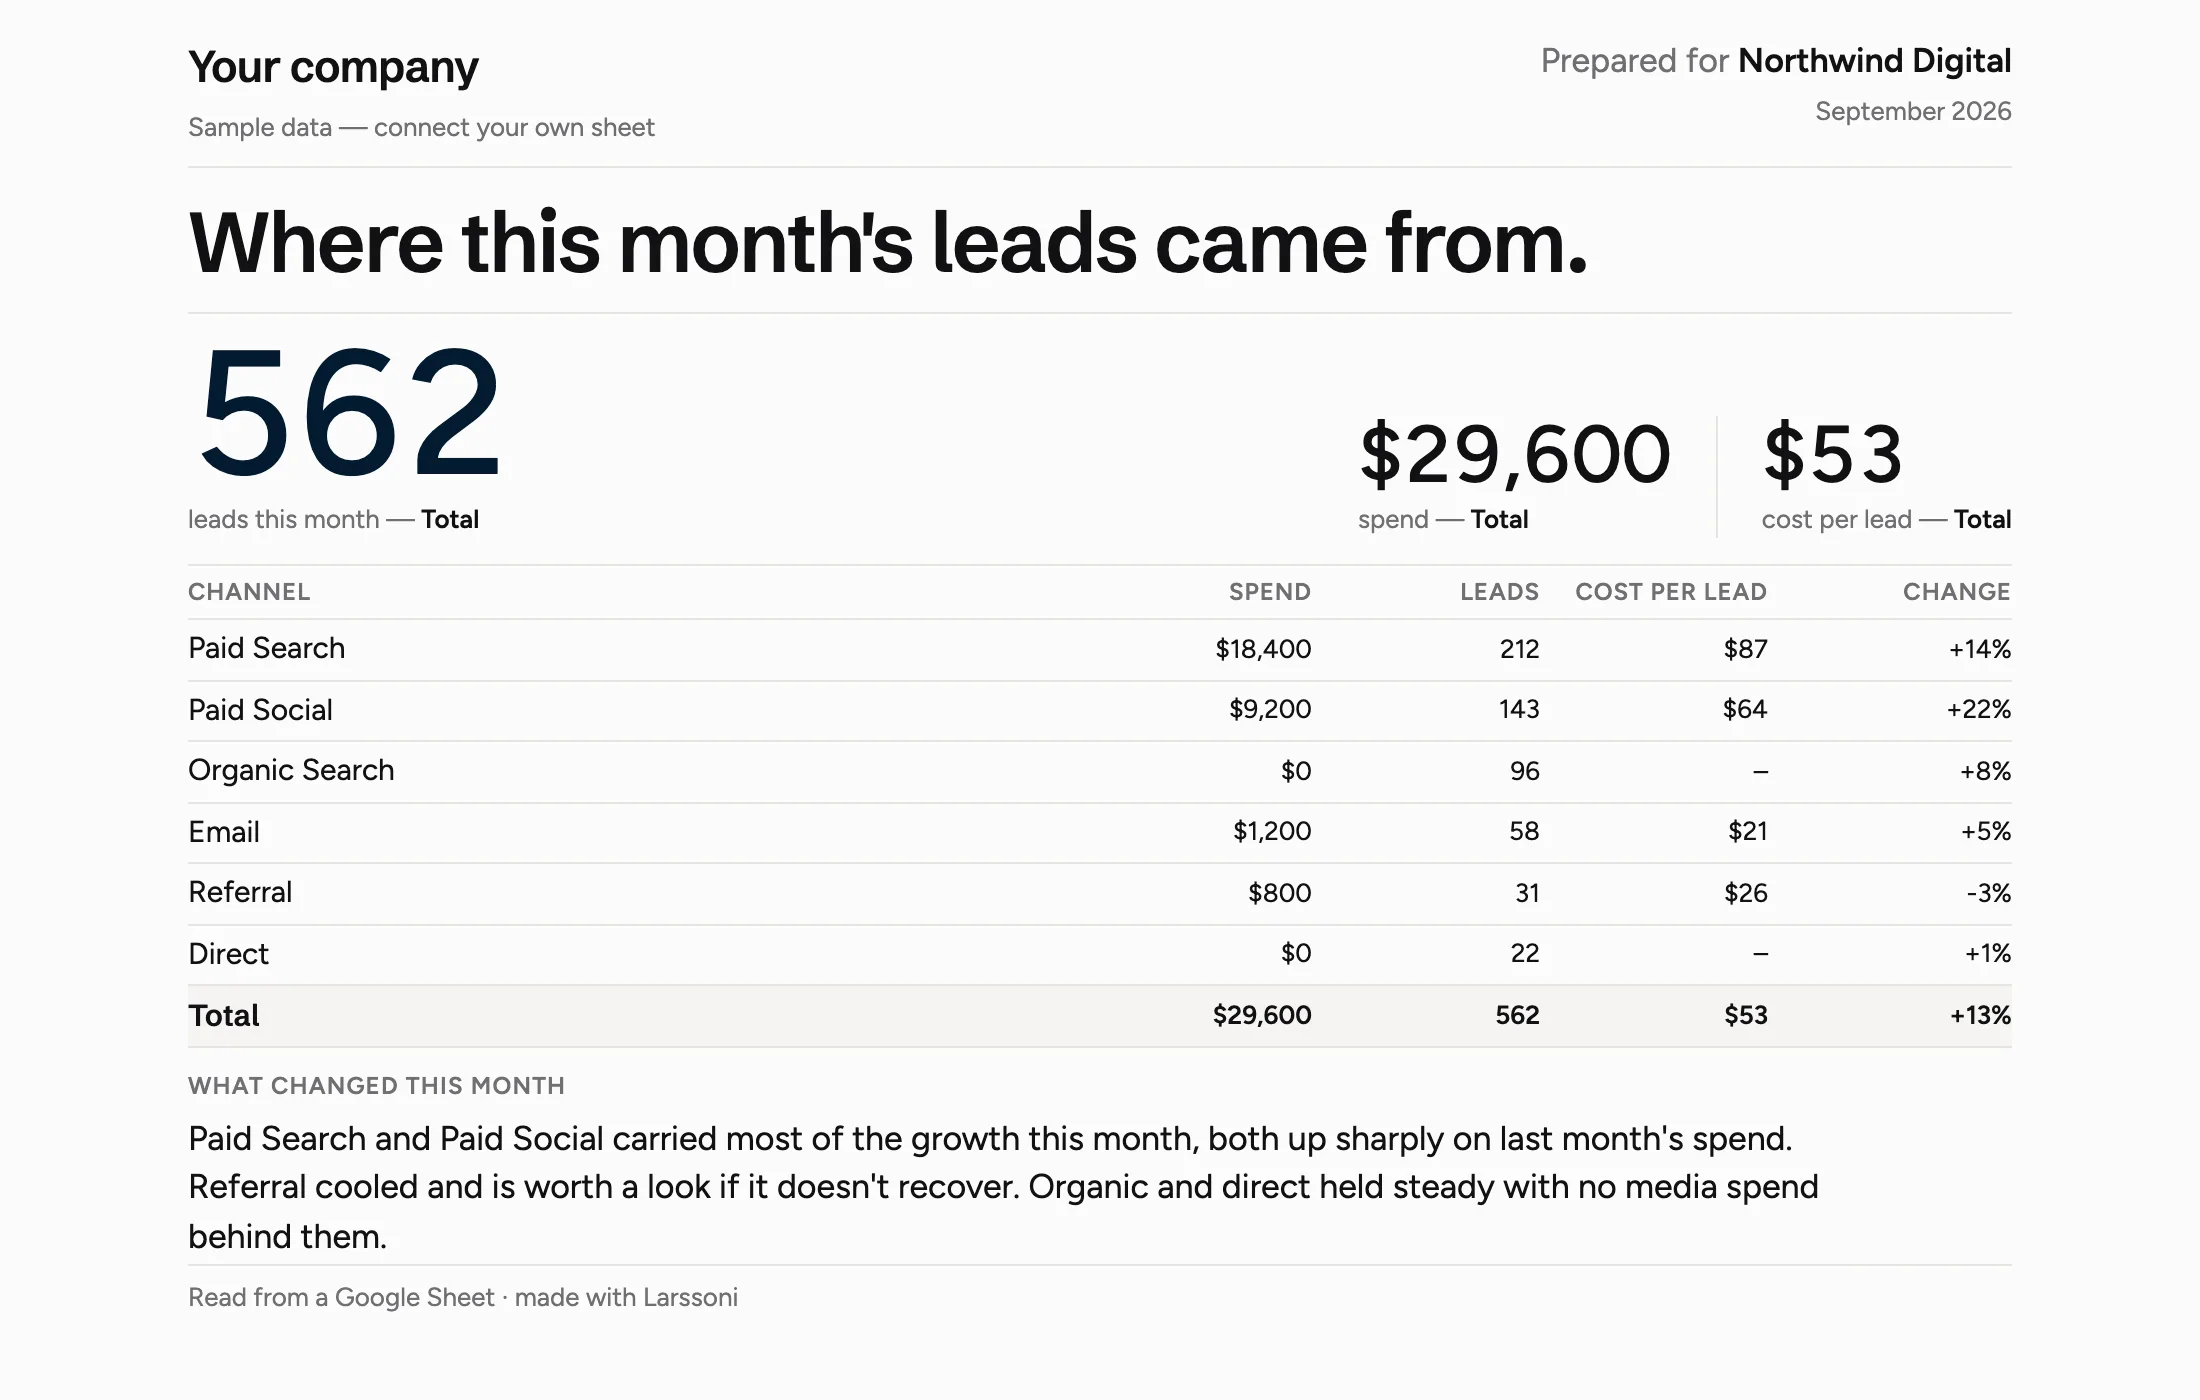
Client report
The page you send a client every month — what came in, channel by channel, with a short note in your own words.
- The spreadsheet
- channel · spend · leads · cost_per_lead · change7 rows
Import the CSV, paste the file, connect your sheet — the rest is already built.
Open Larssoni